Categories
Networking Open Source Software

Remove Spikes From RRDtool Graphs

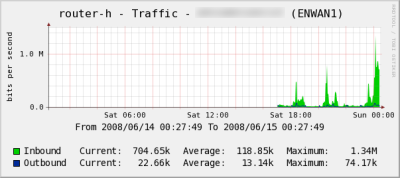
I use RRDtool to make graphs on various things I monitor like server stats, network stats and it does a relatively good job. My one (big) complaint is that when you restart you occasionally see these gigantic spikes that completely mess up the data. I’ve even seen spikes larger than what the system can technically handle.

Nobody mentioned there’s a removespikes.pl script (download) that will remove these outliers from your rrds. I put together a quick shell script to make it quick for when I need to run it again:

!/bin/sh
 
for i in /path/to/graphs/rrd/*;
do
        perl removespikes.pl $i;
done;

If you have a ton of graphs a quick shell script to iterate through the directly may be quicker. If you only have a handful like me, no big deal.

Keep the script around for the next time you have spikes to deal with.

Categories
Apple Networking Open Source

Compiling RRDtool 1.3.x On Mac OS X

I’ve recently been trying to upgrade RRDtool to 1.3.x as I’ve previously been using 1.2.x. New in 1.3 is moving to Cairo graphics, which is pretty cool and provides much better anti-aliased text. MMAP IO should also help since I run it on an old box. It’s a worthwhile upgrade.

Categories
Networking

Goodbye MRTG

I’ve finally got just about all the network graphs I maintain using RRDtool rather than MRTG. I started doing this since MRTG isn’t good for graphing things with more than 2 sets of numbers. I started doing this because I wanted to track cable modem data. I figured while I’m at it, I should move other stuff too.

So much easier to read, and so much faster since your not spitting out graphics files every time the system polls. Not to mention the quality of the graphing image is much nicer. These are shrunk a little and they still look great.

Traffic

Ping

MRTG is still running, but I think I’ll shut it down as soon as I can verify things are working the way I want.

Categories
Networking

Cable Modem Power Level Graphing

As I hinted last week, I graph a fair amount of data, since I find it pretty handy at times, not to mention just interesting to see in a pretty graph form. I’ve been doing this for years and it’s served me well.

One thing I really wanted to get going was monitoring the cable modem’s power levels. This is now implemented:

Cable Modem Power Levels

How pretty is that? I also moved my ping/latency graphs away from MRTG to RRDTool based graphs. Next up is interface traffic (when I get around to figuring out why it didn’t work when I just tried it).