Categories
Around The Web Politics

Median Home Prices vs. Median Income

The national median existing-home price in July 2010 was $182,600 [source]. The median household income in 2008 was $52,029 [source]. To account for some rising income and play it conservative we’ll call it $55,000 for 2010. I haven’t found any official number later than 2008. We should also note that this estimation ignores the current recession and its impacts like reduced hours, layoffs, and pay cuts.

The old rule of thumb is the maximum house you can afford is 3X your gross income minus obligations (debts). More than that and you’re odds of running into trouble making payments and affording upkeep/taxes becomes too high. That means the median affordable house is $165,000 if the household had no obligations. We of course live in a world of car loans/leases, $100+ cell phone bills, expensive broadband internet, and rising food prices. According to MSN Money the average household owes $8,000 in credit card debt alone [source].

For a more specific example, New Jersey’s median household income in 2008 was $70,347. Per Capita New Jersey is one of the most affluent states in the country. The median value of homes in 2000 was $170,800 [source]. The median price in the Northeast in July 2010 was $263,800. Assuming the median income rose to $75,000 the maximum affordable house is $226,041, again assuming no other obligations.

I should also note this rule of thumb was before the bubble and before banks became borderline paranoid about lending money.

The home ownership rate in the US is 67.8% [source (xls)] which means it’s a pretty representative part of the US population, hardly a niche group which we could suggest lives outside these numbers.

Using this back of the envelope calculation I propose that the housing bubble for existing homes doesn’t end until either the median existing-home price falls to meet the maximum affordable house index, or the incomes rise and debts fall to meet the existing-home price index. Only then will the supply and demand curve finally meet and the market volume will increase. Personal income and wealth are too tight for either the supply or demand side to cave right now. I further propose that housing prices will fall faster than incomes will rise.

Translation: the housing market hasn’t finished correcting.
Categories
Internet Politics

Redefining Broadband

The FCC for years has been considering any connection greater than 200kbps to be broadband. For the past several years that’s been pretty misleading. In addition, they only collect downstream, not upstream. They also consider an entire zip code to have broadband if only 1 home can get it. That’s not very accurate. This makes the broadband situation in the US look better than it really is.

The definition of broadband in the US is now being redefined as 768kbps. They will now collect upstream data, and use census-track data. This is a major win since it will more accurately show how many people really do have broadband, and more importantly how many do not.

I personally disagree on the number and think it should be at least 2Mbps, but it’s a win regardless.

The pacific rim annihilates the United States when it comes to broadband. According to Akamai’s State Of The Internet for Q1 2008 high broadband (greater than 5Mbps) is where we really start to show our deficiencies. Here’s a look at broadband which they define as simply greater than 2Mbps:

Rank Country % >2Mbps Q4 07 Change
Global 55% -2.0%
1 South Korea 93% -1.5%
2 Belgium 90% +1.5%
3 Switzerland 89% +0.5%
4 Hong Kong 87% -1.5%
5 Japan 87% +1.0%
6 Norway 83% -2.3%
7 Tunisia 82% +29%
8 Slovakia 81% +0.5%
9 Netherlands 78% -2.6%
10 Bahamas 74% -3.0%
24 United States 62% -2.8%

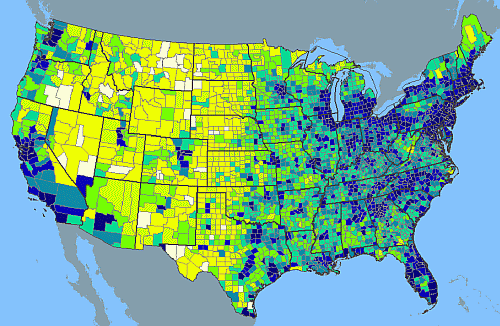
Pretty pathetic considering our last Vice President invented the Internet 😉 . We are the largest in terms of sq miles, but when you consider the US population density, the bulk of our land is very sparsely populated. 80.8% of the US population lives in an urban setting [Warning: PDF].

US Population Density

Japan by comparison has 66.0% of it’s population in an urban setting. Belgium has a surprising 91.5% which may account for it’s #2 position. Switzerland has 44.4% yet makes 3rd place threatening Belgium’s position.

I’m far from the first one to complain about the poor state of broadband. BusinessWeek and CNet both have relatively good discussions about the topic.

The future of media is clearly moving online as people demand to consume it on their schedule as they desire. Take a look at some of the statistics and it’s clearly a large industry. I suspect the lack of broadband infrastructure will be a real problem in the next several years as the rest of the world becomes very easy to distribute media to, and the US still faces challenges.

Solution? Highly debatable, but if so many other countries can do something about it, I suspect it’s achievable here in the US as well. I suspect that the taxes made from companies that do business on the internet from ecommerce to advertising would make this a decent investment for the US government to at least partially back. The more places companies make money, the more places the government does. That may be necessary as not all markets are profitable enough for telco’s to bother with. There have been various attempts to jumpstart this effort, but none to date have been successful.

It’s not only about just having access, it’s also the cost. As BusinessWeek points out in the article above, broadband in the US is not cheap.

Perhaps wireless will finally allow for competition and lower prices, at least that’s what everyone is hoping for. The question is if it will happen, if the technology will be there (wireless is generally high latency), and if it will be affordable for the common man.

I suspect in the next 4 years this will become and even bigger topic of discussion as some of the top ranking countries start to reach the point of saturation.